Using Topology to Track Ocean Patterns
As part of the Ocean of Things program organized by DARPA, my team was tasked with developing new methods for oceanographers to track relatively small - or “submesoscale” - oceanographic phenomena like eddies (i.e. vortices in the ocean). You can read the full paper here.
This problem is challenging because large oceanographic simulations of high resolution (1-5 sq km) can contain an immense number of eddies - some of which are found inside larger eddies! Identifying these eddies isn’t too hard thanks to previous work from the oceanography community. Simultaneously, tracking each of them through time, however, was much harder.
To solve this multi-object tracking problem, we applied tools from topological data analysis (“TDA”) to identify and track these eddies. TDA allows us to quickly identify features on scalar fields and then efficiently associate these features between time steps. Doing this for many time steps creates a set of track segments that can be chronologically ordered to determine the speed and direction of a feature between any two time steps or in aggregate over the life of that feature.
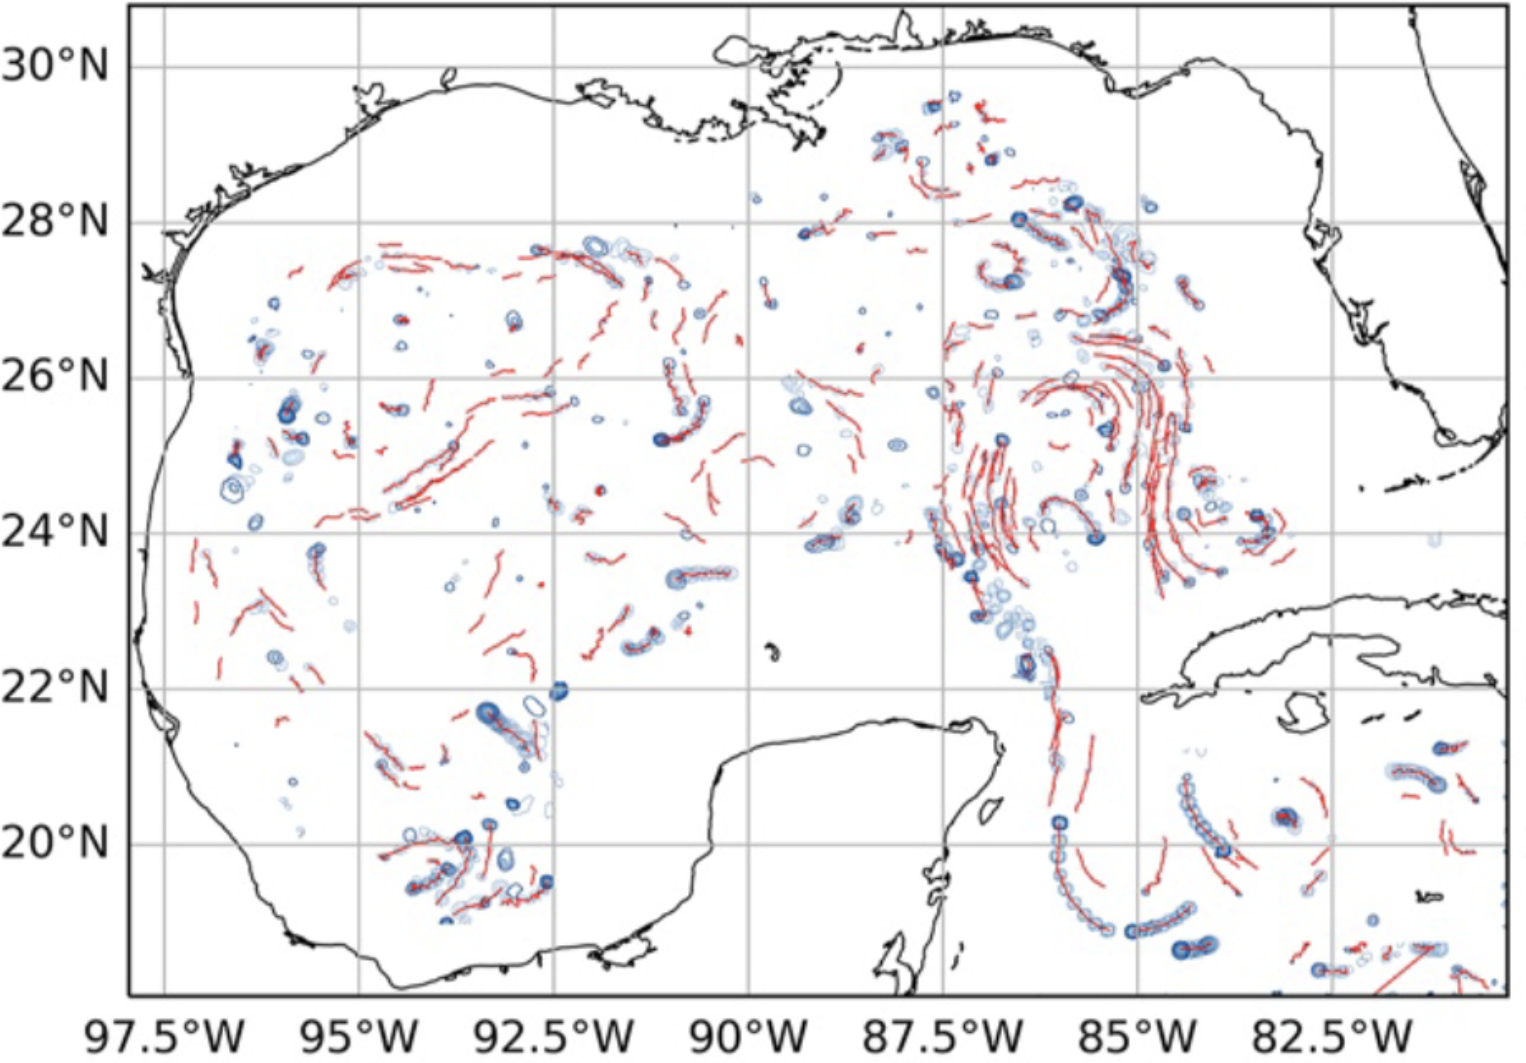
In our case the fields are generated from large simulations of oceanic activity. We calculate a scalar measure of vorticity at all points in the simulation to get our scalar field. We identify critical points in this field as vortices and track them as they are generated and dissipate. The image below depicts a few vortices (the blue contours) and their paths (red line segments) in the Gulf of Mexico

Our research can be used for remediating pollution, predicting harmful algal blooms and informing search and rescue missions. See the paper for the full details, and feel free to reach out with any questions!
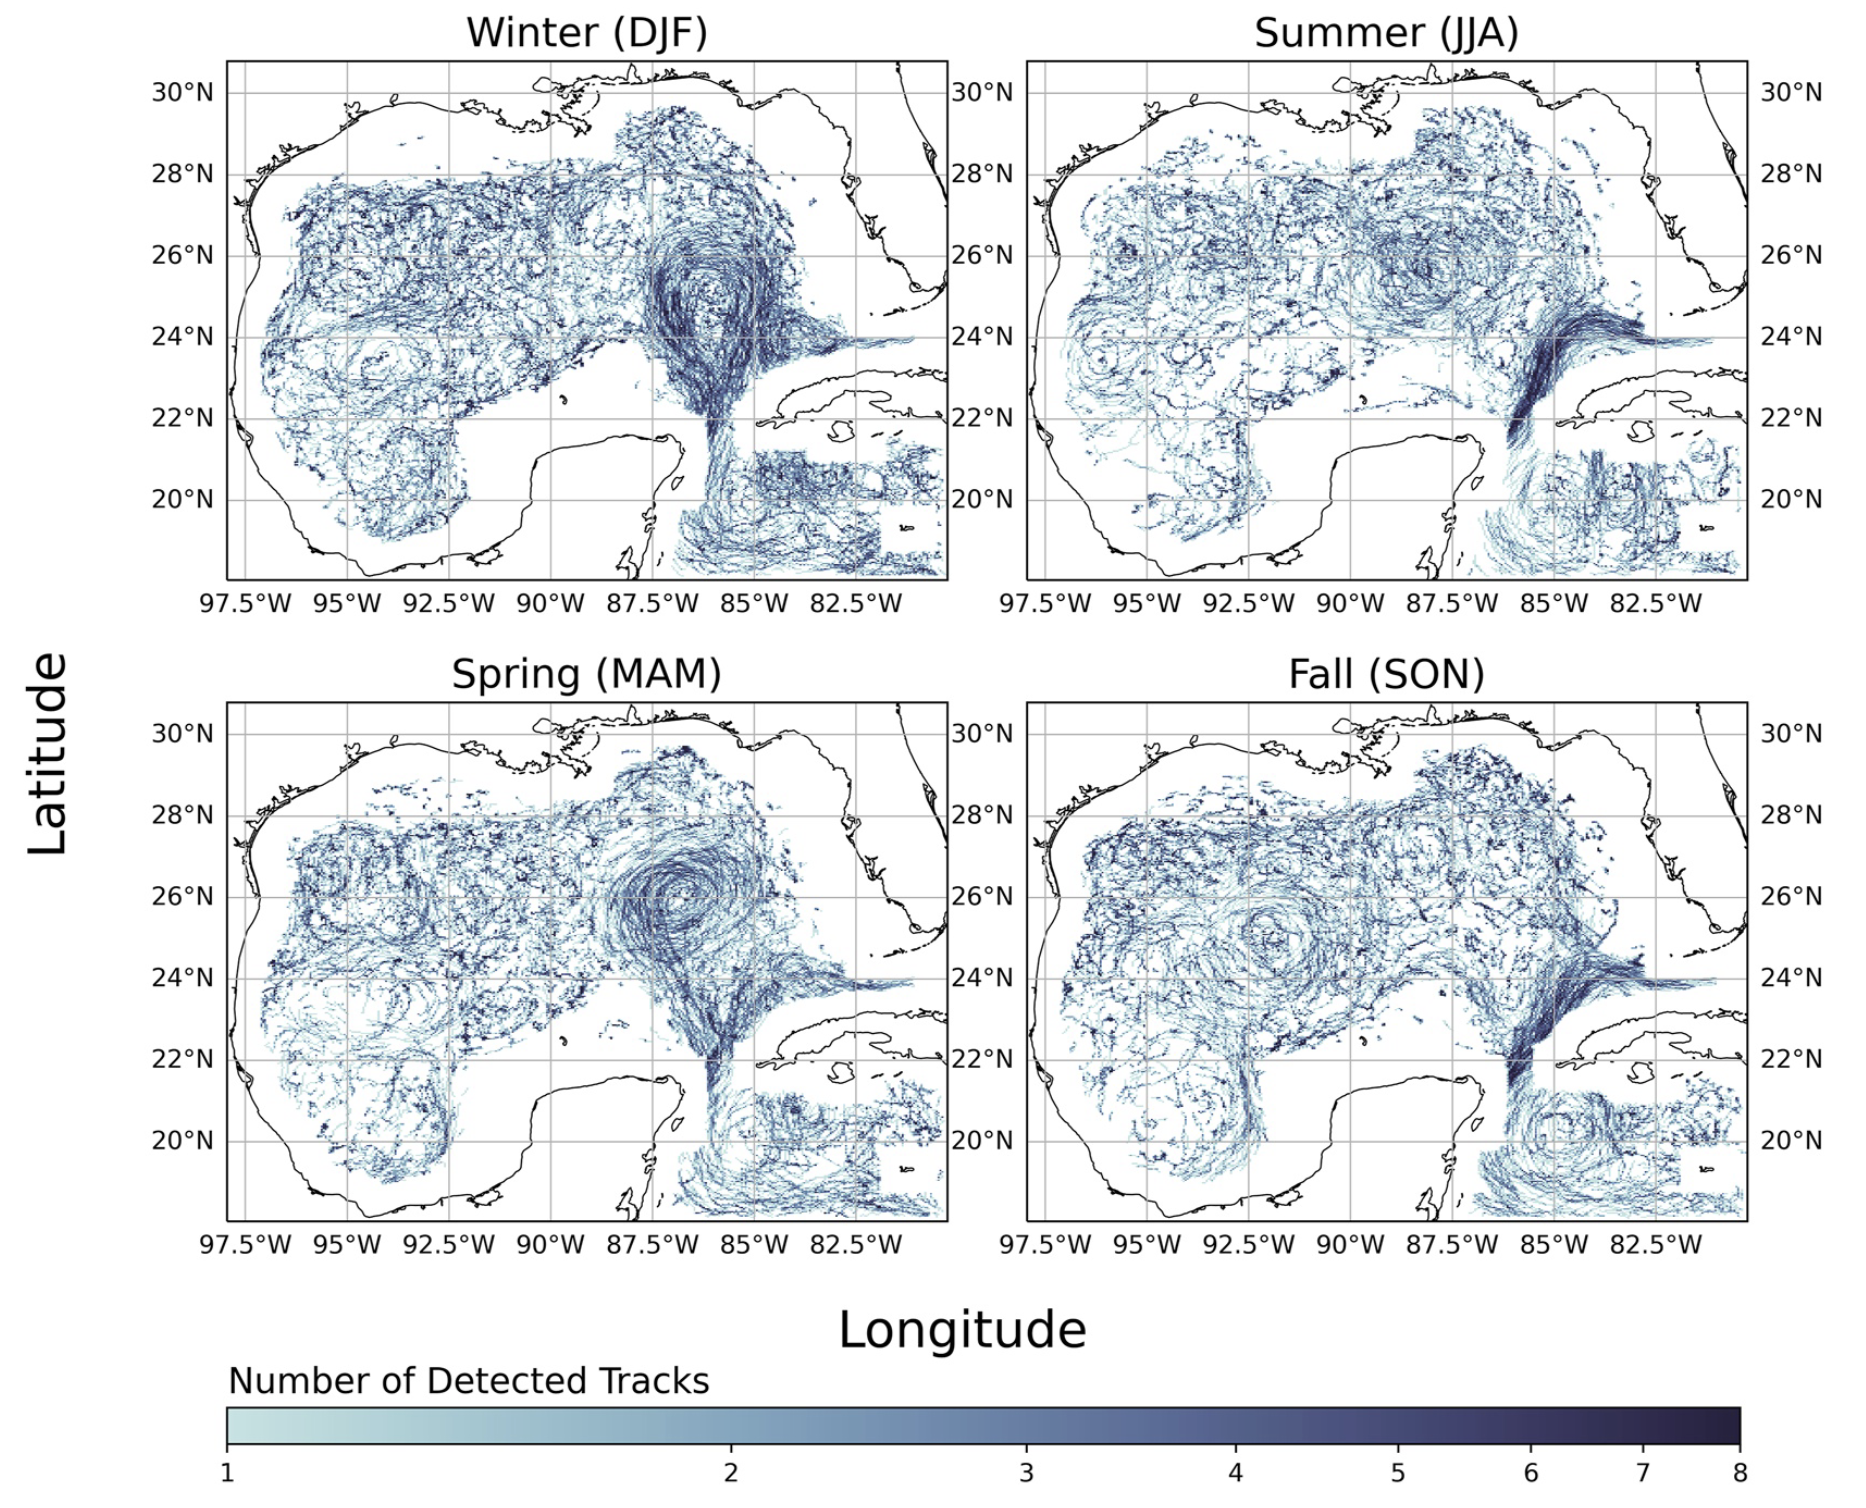
The image below (from figure 3 in the paper) shows tracks generated in the Gulf of Mexico over three months. Can you see the large-scale current moving smaller features around the Yucatán Peninsula, Cuba and Florida?
